Enhanced Analytics

An optional subscription you activate inside the dashboard. Unlock tools to join weigh data and other records, compare locations, dig into alarm patterns, and produce deeper reports and map views of the shed.

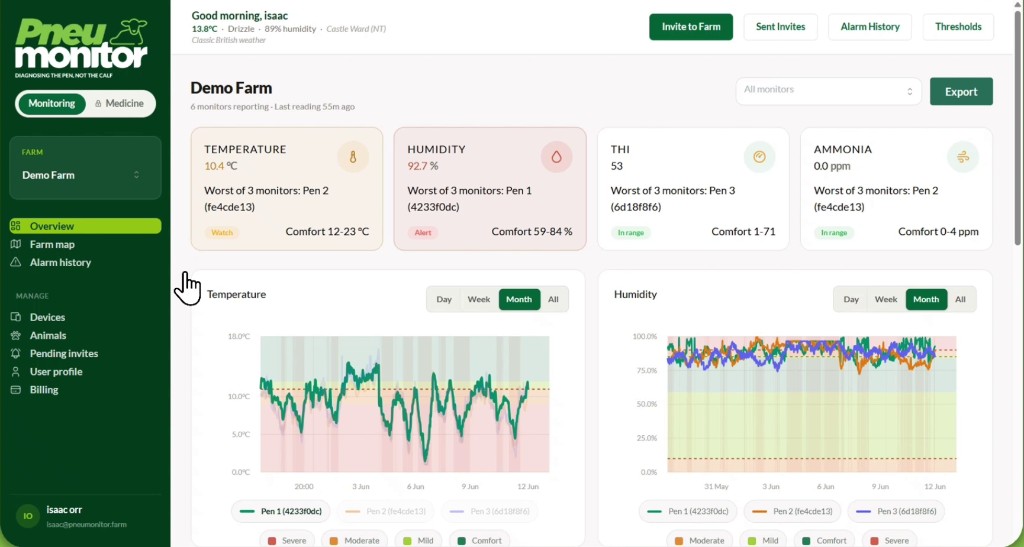
Pneumonitor dashboard overview showing temperature, humidity, THI and ammonia summary cards with month trend charts for three pens

Tools that turn housing data into decisions

Live readings tell you what is happening now. Enhanced Analytics helps you work out why, where, and what to change.

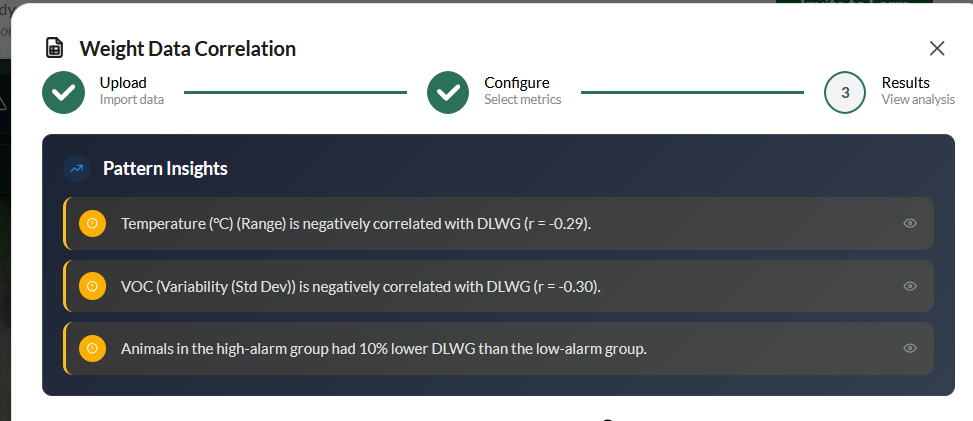
Weight Data Correlation results showing pattern insights linking temperature, VOC variability and alarms with daily live weight gain

Bring weigh data and other records in

Upload performance data such as daily live weight gain, then see what the animals are most susceptible to. Pattern insights flag correlations like temperature swings, air quality variability and high-alarm groups against growth.
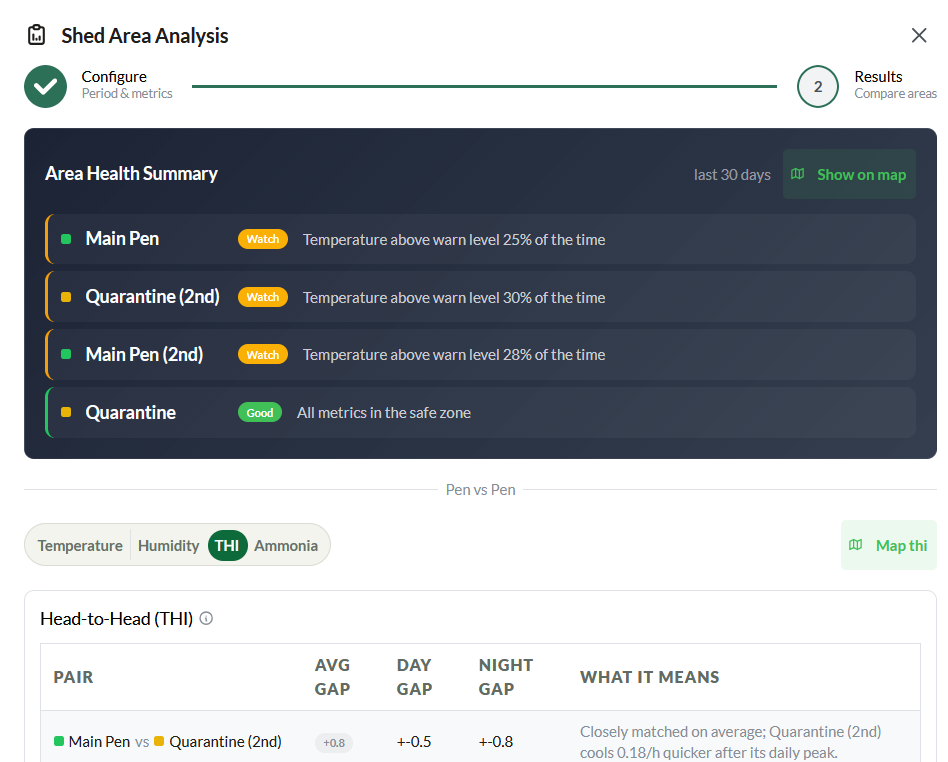
Shed Area Analysis comparing pens with an area health summary and head-to-head THI gaps

Compare locations across the shed

Rank pens by health over the period you care about, then go pen vs pen on temperature, humidity, THI or ammonia. Plain-language gaps show the best and worst spots, not a shed average that hides the problem.

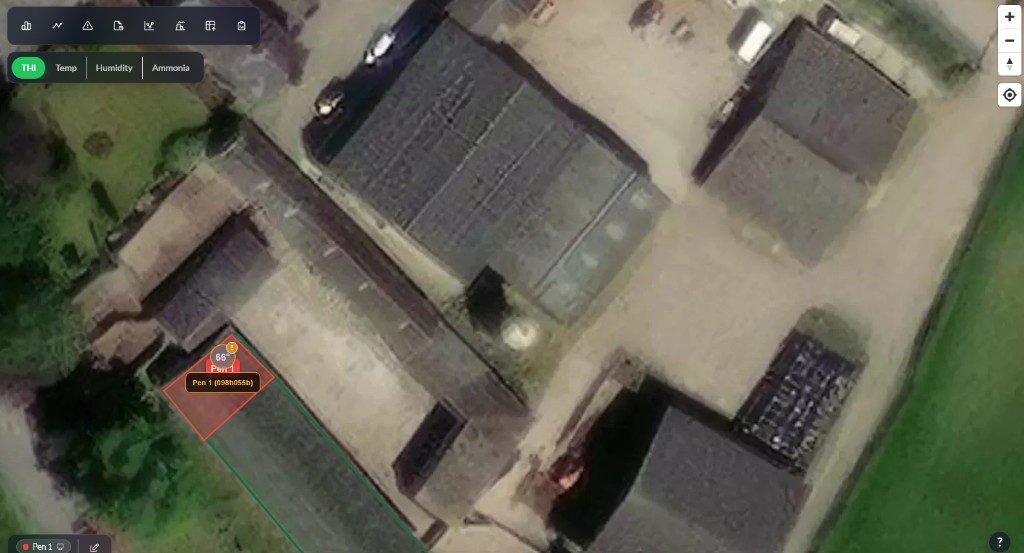
Satellite map of farm buildings with a monitored pen highlighted and metric toggles for THI, temperature, humidity and ammonia

Map views of the building

See conditions on the farm layout. Switch between THI, temperature, humidity and ammonia so advice is about a real place in the shed, not one number for the whole barn.

  1. Alarm analysis

    Look past single alerts. Spot patterns over time: recurring windows, pens that tip first, and conditions that keep pushing thresholds.

  2. Extra reports

    Generate clearer, deeper reports for the farm, the vet visit, or the next housing change - more than the standard dashboard views.

  3. Activate in the dashboard

    Enhanced Analytics is a subscription you turn on from inside your Pneumonitor dashboard. No separate install: subscribe when you are ready and the tools appear where you already work.

Activate the subscription in your dashboard when you want to go further than live monitoring alone.

See the live dashboard first →

Ready to activate Enhanced Analytics?

Open your dashboard to subscribe, or talk to us if you want a walkthrough of the tools first.

Pneumonitor — diagnosing the housing, not the animal