Live insights, anytime
A live dashboard for temperature, humidity and ammonia, plus alerts when housing conditions turn risky. Check it from the farm or away.
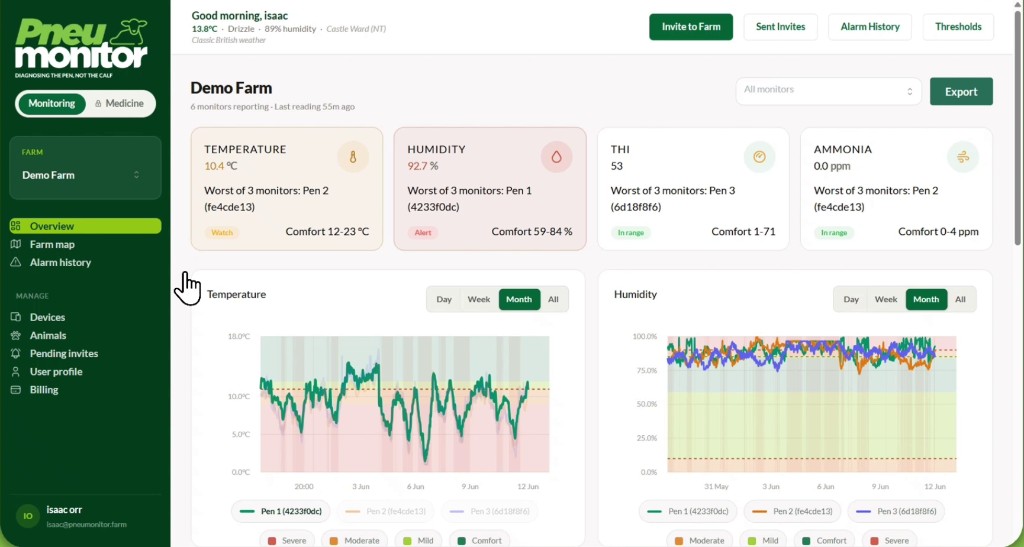
See what the housing is doing before animals look sick
The point is not more charts. It is knowing when the air turns against you early enough to act.
-
Live readings
Current conditions across your monitors, so you can spot a problem while there is still time to act, not after pneumonia, heat stress or a lost day has already taken hold.
-
History you can use
Trends matter as much as today’s number. Historical data helps you see which pens or areas drift into risk, whether a fix worked, and where to focus next.
-
Alerts you control
Notifications are based on AHDB guidance and can be tailored by you or your vet. Turn them on for the farms and people who need them. Leave them off where they would only be noise.
Watch the housing in real time, then go deeper when you need answers. Enhanced Analytics builds on the same dashboard.
Explore Enhanced Analytics →Want live housing data on your farms?
Tell us about your setup and we will help you get started.